
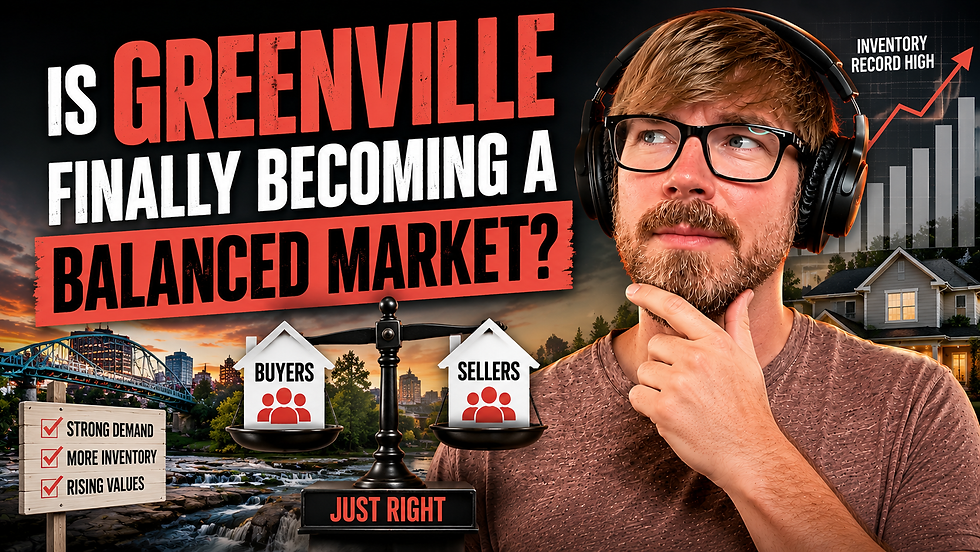
What Would It Take for the Housing Market to Crash?
- Mar 30, 2022
- 5 min read
Every time mortgage rates jump, or multiple offers become the norm, someone asks, “Is this 2008 all over again? ” In a recent Selling Greenville episode, a Greenville, South Carolina, realtor walked through the question with hard numbers and local context. Instead of fearmongering, he put today’s market next to the run-up to the Great Recession—days on market, supply, demand, and foreclosures—and asked the uncomfortable question head-on: what would it take for the housing market to crash in Greenville?
Spoiler: if the last crash was a housing-led recession, today’s landscape looks fundamentally different. Prices can be cool. Frenzy can fade. But a true crash? The data says that it would take a shock of historic proportions.

What Would It Take for the Housing Market to Crash? (Greenville Edition)
What Would It Take for the Housing Market to Crash? The title question isn’t a vibe check; it’s a math problem. The episode’s frame was simple: compare the months leading into the 2007–2008 crash with the present Greenville market and see what would need to change—specifically, supply, demand, days on market, and foreclosures.

1) Days on Market: Then vs. Now
2007 (pre-recession): Homes typically sat 80–100 days before going under contract. That’s roughly three months—a classic oversupply relative to demand.
Today: The average is 20–30 days. That’s a third (or less) of the pre-recession timeframe, and it reflects the opposite imbalance: too little supply for too much demand.
If the market were about to buckle the way it did, then time-to-contract would be stretching, not compressing.
2) Prices and When They Actually Fall
Median prices didn’t immediately fall when the Great Recession began. The Greenville data shows the clear break coming in spring 2009, well over a year after the recession’s widely accepted December 2007 start. Why the lag? Foreclosures.
Once banks started the foreclosure process in 2007–2008, it still took time for those properties to hit the market. When they did, they were cheaper than traditional resales and pulled the median down. In short, falling prices followed a wave of distressed inventory—not just bad headlines.
3) Foreclosures: The Big Tell
This is the fulcrum. Back then, foreclosure rates were marching up from 2005 through 2007, and then skyrocketed in 2008–2010. Contrast that with the recent picture:
2007: Roughly 1%+ of housing units in foreclosure nationally.
2021: About 0.11%—the lowest reading in the chart the host reviewed.
That’s nearly a 10x gap. To recreate a price-dragging distressed wave, foreclosure activity would have to surge dramatically. And even if that started today, there’s a built-in lag before those properties list and impact pricing—just like 2007–2009.
4) Supply: Inventory Then and Now
2007: The months’ supply hovered at 6–8 months—a buyer’s market. Total active inventory ran around 7,000 units (homes, condos, etc.).
Today: A month’s supply sits around for 1–2 months. Total inventory is closer to 2,000 units—roughly 70% less than in 2007.
To return to 2007-style supply, inventory would have to balloon—fast. The episode points out why that’s so unlikely: new construction is constrained by lingering supply chain issues, tighter local regulations, and mounting pushback against farmland-to-subdivision conversions. The only real cure for low supply is building, and building isn’t keeping pace.
5) Demand: Closings Tell the Story
February 2007: ~750 closings in greater Greenville.
February 2022: ~1,150 closings—a 50%+ increase, achieved despite far lower inventory.
That’s the demand picture in a sentence: more buyers competed for fewer homes and still closed at a materially higher rate.
6) Lending Quality: Not 2005–2007 All Over Again
Even without spreadsheets, the composition of today’s buyers looks less fragile:
Over a quarter of local transactions are cash.
Many financed buyers bring 10–20%+ down payments.
The Wild West lending of 2005–2007—no-doc loans and widespread zero down/ARMs that could jump five to six points overnight—is not the backbone of this market.
More equity at purchase and better-underwritten debt blunt the path from “economic wobble” to “distressed sale.”
The Math of a Crash: How Extreme Would It Have to Be?
It’s one thing to say “unlikely,” and another to quantify it. The episode does both.
To get back to 2015–2016 levels (when Greenville shifted from a buyer’s to a seller’s market), one path would be to keep new listings roughly where they are (~1,600/month), but cut new contracts by 20% overnight and hold that lower demand level for 8–9 months. That still lands the market in seller’s-market territory—not a crash, not even 2007.
To get back to 2007 levels by year-end, demand would need to drop 40% immediately and stay there for nine months straight. That’s a more forceful shock than Greenville experienced as the 2007–2008 recession unfolded—and it would still only recreate the pre-crash setup, not the crash itself.
To actually see 2008–2012-style buyer’s market conditions—multi-month listings, falling prices—Greenville would also need a surge in foreclosures, and the episode notes we’re starting from record lows.
Put simply: a minor slowdown won’t do it. A routine recession likely won’t do it. The host’s read is that it would take something bordering on a Great Depression-scale shock—or a major geopolitical catastrophe—to invert supply and demand so violently that Greenville prices broadly fall and stay down.
Rates, Inflation, and the “But What If…” Questions
Mortgage rates rising from the low 3s to around 5% (as they did rapidly at the time of the episode) can cool activity at the margins. They change monthly payments and force some buyers to rethink budgets. But the episode draws a line: higher rates alone won’t conjure 7,000 active listings, push days on the market to 80–100, or create a foreclosure wave.
Will price growth slow eventually? That’s reasonable. In fact, the host openly expects appreciation to moderate at some point. But out in the field, as of the recording, he wasn’t seeing it yet—especially not at the median price points where competition remained “crazy.”
And if rates ever fall again? Buyers who purchased at higher rates may eventually refinance. Prices, on the other hand, rarely reverse in Greenville absent the distressed wave dynamic described above.
Why the Last Crash Was Different
One more critical distinction from the episode: 2007–2008 was a housing-market crash that caused a recession. Today, it would likely take a recession severe enough to destroy demand first, which would then feed back into housing. That’s a slower, harder-to-trigger chain reaction than the mortgage-debt-led collapse last time.
Practical Takeaways for Greenville Buyers and Sellers
Don’t anchor to 2008. The inputs are different: stronger buyer equity, tighter underwriting, record-low foreclosures, and a persistent supply choke.
Expect persistence, not perfection. Low supply and high demand have been years in the making. They won’t unwind in a quarter.
Watch foreclosures, not just rates. If there’s a single early warning for sustained price declines, it’s distressed inventory rising substantially for many months.
Plan for competition. The episode cites average listings/pendings around 1,600/1,400 per month—evidence that well-priced homes still move quickly.
Watch Or Listen To The Selling Greenville Podcast
Subscribe to the Selling Greenville podcast for real-time insights, bold perspectives, and unfiltered takes on the Upstate housing scene. Whether you’re buying, selling, or simply watching the market unfold—this is where Greenville goes to stay informed.
Bottom Line
If the question is what it would take for the housing market to crash, the Greenville answer is: a lot. Think a 40%+ immediate demand drop held for nine months, inventory swelling far beyond anything builders can currently deliver, and a dramatic spike in foreclosures—from today’s ~0.11% national baseline back toward (or beyond) 2007-era levels. The episode’s conclusion isn’t that prices can’t cool or that bidding wars are forever; it’s that the preconditions for a true, sustained price decline aren’t in place. In the absence of an extraordinary shock, Greenville remains a low-supply, high-demand market—more likely to moderate than to mirror 2008.
Ien Araneta
Journal & Podcast Editor | Selling Greenville


Comments